Equivalent JavaScript, Rust, and C# timing
Six runtimes, one measured boundary
One warmup + five measured pipelines
Every row initializes its host and language runtime first, discards one warmup, then times five fresh executions of the same 1,000,000-case, 1,000-suite lifecycle pipeline. The resolved runner-entry invocation, case naming, arithmetic, the wrapping checksum, lifecycle calls, report materialization, per-suite checks, final validation, and runtime-managed work triggered during the call are inside every timer. Startup, module loading, initial module compilation or instantiation, coverage, memory probes, report encoding and file output, and teardown are outside every timer.
Loading equivalent language benchmark data…
| Language / runtime | Five raw samples | Median | Throughput |
|---|---|---|---|
| Loading six equivalent runtime lanes… | |||
Runtime implementation, clock, garbage collection, and host architecture still differ naturally; the work included by the timer no longer does.
Separate JavaScript framework protocol
Cold-pipeline run and machine
Loading signed-off benchmark data…
This machine card and the scaling/framework sections below come from the separate JavaScript datasets, not the six-row initialized-runtime record above.
Algorithm boundary
Core lifecycle scaling
Loading signed-off scaling data…
Each point puts 250 through 16,000 uniquely named passing cases in one runner. Imports and report() are outside the timer; construction plus expects(), pass(), and done() are inside it. The exact 2.1.1 index.js is reconstructed from Git and uses the same installed dependencies as the candidate.
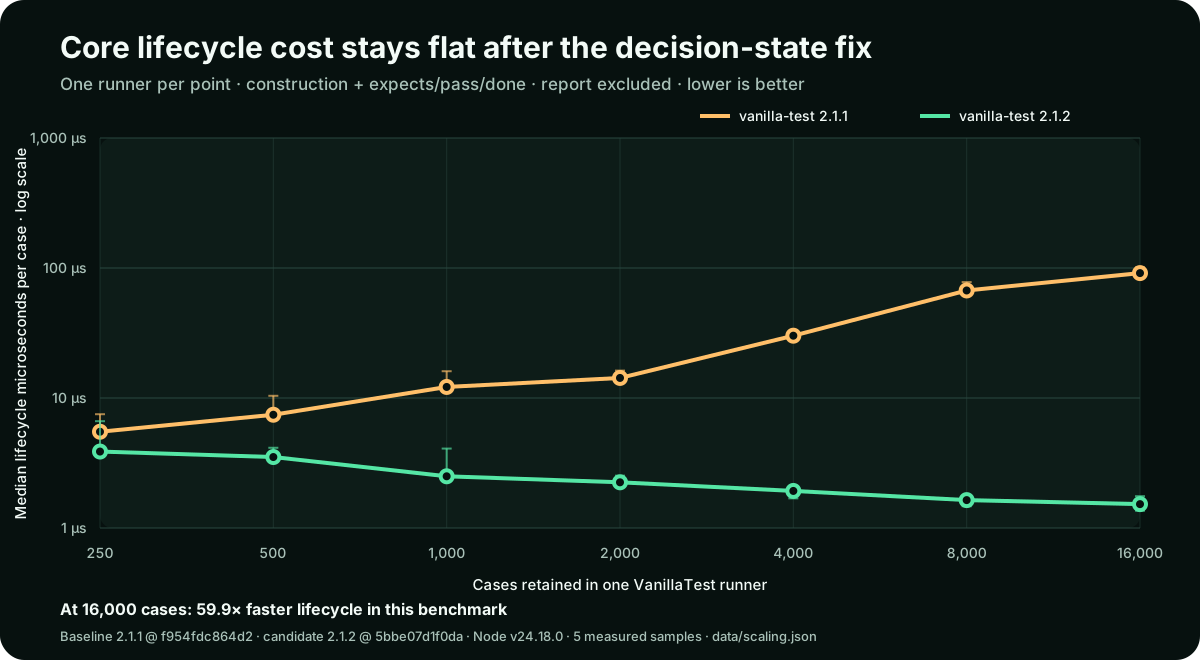
| Cases in one runner | 2.1.1 median | 2.1.2 median | 2.1.1 per case | 2.1.2 per case | Faster |
|---|---|---|---|---|---|
| Loading core-scaling samples… | |||||
Waiting for scaling provenance…
Run the equivalent browser lane here
JavaScript browser benchmark
Page and modules initialize before timing
This page loads the JavaScript runner first, discards one warmup, then times five fresh calls to the shared lifecycle pipeline with performance.now(). It uses the same contract as all six published rows.
Ready to run in this browser.
| Raw samples | Median | Throughput |
|---|---|---|
| — | — | — |
Complete host pipelines
One-million-case overview
Independent zero-based axes
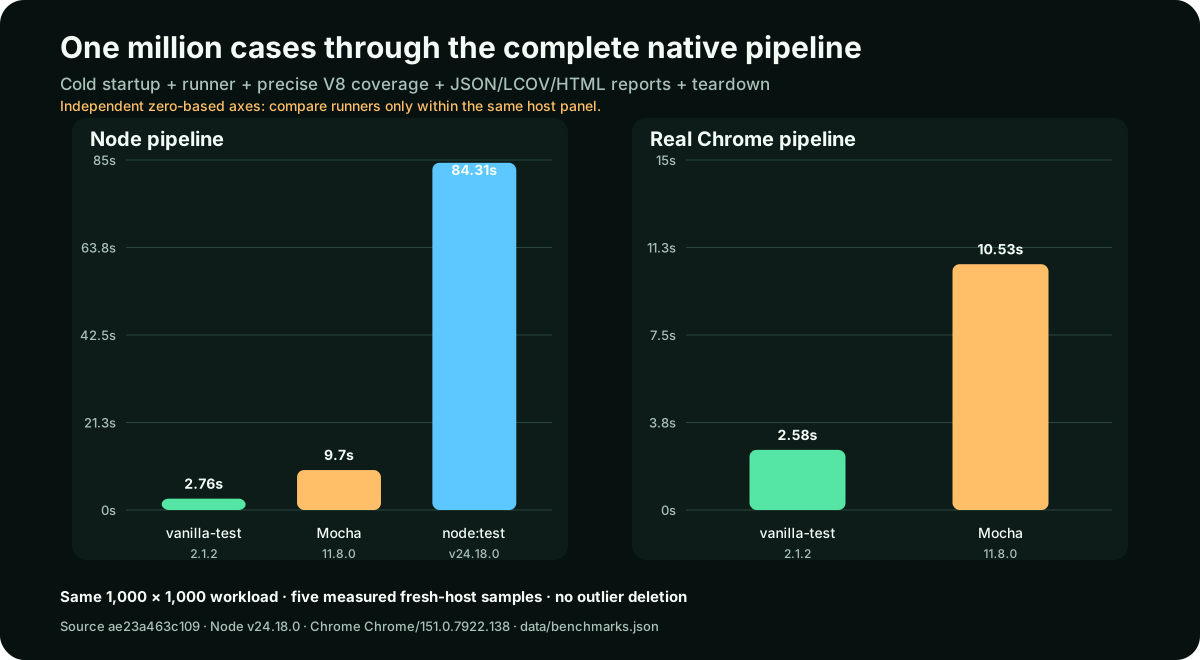
Native Node only
Node pipeline
Fresh worker + test child per sample
| Runner | Cold wall | Full pipeline | Runner phase | Cold throughput | Peak sampled |
|---|---|---|---|---|---|
| Loading Node samples… | |||||
Real browser only
Google Chrome pipeline
Fresh isolated Chrome profile per sample
vanilla-test works with bundlers and without a bundler. This benchmark exercises the native no-bundler ESM path through an explicit document-relative import map; package imports and startup remain outside the measured lifecycle.
| Runner | Cold wall | Full pipeline | Runner phase | Cold throughput | Peak sampled |
|---|---|---|---|---|---|
| Loading browser samples… | |||||
Node peak is sampled process RSS; Chrome peak is sampled renderer JavaScript heap. Treat them as host-specific context, not a cross-runtime memory ranking.
Its Node and Chrome rows include different startup and host costs, so compare frameworks only within the same host panel. The six-language table above uses the separate aligned boundary.
Native Rust + browser WebAssembly
One Rust harness, two runtimes
Rust 1.85 · one warmup + five measured samples
The native and browser lanes execute the exact same Rust pipeline: 1,000,000 globally named passing cases across 1,000 fresh suites, the shared arithmetic and checksum workload, every lifecycle call, report materialization, and final validation. Each lane stays separate because its runtime and clock differ.
Loading published Rust benchmark data…
| Runtime | Verified workload | Raw samples | Median | Throughput |
|---|---|---|---|---|
| Loading Rust samples… | ||||
Run the published artifact locally
Rust browser-WASM benchmark
Compilation and instantiation stay outside the timer
The browser compiles and instantiates the zero-import module once, resolves the namespaced repeat-call-safe vanilla_test_benchmark_run_v1() export, discards one warmup, then times five calls on that initialized instance. Every call recreates all logical workload state.
Ready to run in this browser.
| Raw samples | Median | Throughput |
|---|---|---|
| — | — | — |
cargo bench --bench lifecycle
cargo vanilla-test --browser --bench lifecycleRust native and browser rows include the same pipeline boundary as JavaScript and C#: initialized runtime, one discarded warmup, five fresh timed workloads, and no startup, coverage, memory probes, encoding, or file output.
Download the native and browser Rust record. Inspect the exact shared harness.
Native C# + browser WebAssembly
One C# harness, two runtimes
.NET 10 · one warmup + five measured samples
The native and browser lanes execute the exact same C# pipeline: 1,000,000 globally named passing cases across 1,000 fresh suites, the shared arithmetic and wrapping checksum workload, every lifecycle call, report materialization, and final validation. Each runtime remains a separate measurement with its own clock.
Loading published C# benchmark data…
| Runtime | Verified workload | Raw samples | Median | Throughput |
|---|---|---|---|---|
| Loading C# samples… | ||||
Run the published AppBundle locally
C# browser-WASM benchmark
.NET initialization stays outside the timer
The browser initializes one Release .NET WebAssembly runtime, loads the managed export, discards one warmup, then times five calls to the shared C# pipeline with performance.now(). Every call creates fresh suites and workload state; the runtime itself remains initialized between samples.
Ready to run in this browser.
| Raw samples | Median | Throughput |
|---|---|---|
| — | — | — |
dotnet run --project dotnet/benchmarks/VanillaTest.Benchmarks -c Release
dotnet vanilla-test --browser --bench --project dotnet/benchmarks/VanillaTest.Benchmarks/VanillaTest.Benchmarks.csprojC# native and browser rows include the same pipeline boundary as JavaScript and Rust: initialized runtime, one discarded warmup, five fresh timed workloads, and no startup, coverage, memory probes, encoding, or file output.
Download the native and browser C# record. Inspect the exact shared C# harness.
What “end to end” means here
- Cold host.Start a fresh Node worker and test child, or a fresh isolated Google Chrome process.
- Real runner cases.Define and complete 1,000,000 uniquely named cases in 1,000 bounded suites. No raw loop is ranked as a competitor.
- Detailed result work.Materialize each framework's detailed passing report into a silent sink, so terminal spam is removed without deleting report cost.
- Native coverage.Collect untransformed V8 ranges from the identical shared workload in the selected host.
- Four files and teardown.Write test JSON, coverage JSON, LCOV, and standalone HTML; validate hashes and exact counts; then close the host.
Because coverage is enabled intentionally, these are complete pipeline measurements—not claims about isolated assertion nanoseconds. The same project-owned native V8 collector and deterministic HTML/LCOV/JSON reporter wrap every entrant, holding those phases constant while the runner changes. Runner, pipeline, and cold-wall boundaries remain separate in every raw sample.
Why these competitors qualify
node:test
Built into the exact recorded Node runtime, with suites, hooks, mocks, snapshots, reruns, reporters, and coverage.
Official capability referenceMocha
Pinned in the benchmark lockfile, with suites, hooks, async support, filtering, retries, ESM, browser execution, and reporters.
Official browser referenceLightweight loops and less capable micro-runners are excluded from the visible ranking. This prevents a flattering but mismatched comparison.
Inspect the exact benchmark code
The implementation stays available without filling the results page with source. Open any file in a focused native dialog, copy it, or follow its commit-pinned repository link.